 |
|
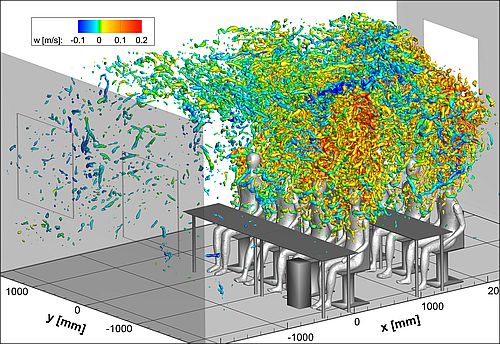
The PIV Course will take place at DLR in Göttingen from March 16 to 20, 2026A significant feature of PIV and LPT is that a reliable basis of experimental flow field data is provided for direct comparison with numerical calculations and hence, for validation of flow simulation codes. During the last years an increasing number of scientists have started to utilize the PIV and LPT techniques to investigate the instantaneous structure of velocity fields in various areas of fluid mechanics. A large number of different approaches for the recording and evaluation of tracer particle images have been described in literature. This course, which is the 33rd Course on PIV since 1993 organized by DLR, will mainly concentrate on those aspects of the theory of PIV and LPT relevant to applications. Besides giving lectures on the fundamental aspects, special emphasis is placed on the presentation of practical and reliable solutions of problems which are faced during the implementation of these techniques in wind tunnels and other test facilities. During practice the participants will have the opportunity to carry out the recording and the evaluation of PIV and LPT images by themselves in small groups. Matured developments of the PIV technique such as Stereo PIV, Time Resolved PIV, tomographic PIV and Micro-PIV as well as advanced 3D-LPT techniques like Shake-The-Box (STB) and subsequent Data Assimilation (DA) will be discussed and demonstrated.
The main interest of today’s research in fluid mechanics is more and more directed to problems where unsteady and separated flows are predominant. For investigations of flow fields with pronounced spatial structures and/or rapid temporal or spatial changes (transition from laminar to turbulent flow, coherent structures, pitching airfoils in transonic flows with shocks, rotors, test facilities with short run time, etc.) optical experimental techniques, such as Particle Image Velocimetry (PIV) and Lagrangian Particle Tracking (LPT) are required which allow to capture the flow velocity of large flow fields instantaneously. |
|

